Unlocking Insights: Crafting Effective Survey Questions
Need survey questions examples? This listicle provides eight essential survey question types, from Likert Scale and Net Promoter Score (NPS) questions to open-ended and matrix questions. Learn how each type can be used to gather effective data, understand their strengths and weaknesses, and see practical examples. Whether you're a marketer, product manager, entrepreneur, or developer, this guide will help you quickly create insightful surveys and gather the data you need.
1. Likert Scale Questions
Likert scale questions are a cornerstone of survey design, offering a straightforward yet powerful way to gauge respondents' attitudes, opinions, and perceptions. Named after psychologist Rensis Likert, these questions present a symmetric rating scale, typically with 5 or 7 points, allowing individuals to express their level of agreement or satisfaction with a given statement. This method's simplicity combined with its quantifiable nature makes it a popular choice for various applications, from customer satisfaction surveys to employee engagement assessments and product feedback collection. This approach is highly valuable in the context of survey questions examples due to its versatility, ease of implementation, and the actionable insights it provides.
Likert scale questions function by presenting a statement and asking respondents to select their position on a pre-defined scale. This scale ranges from one extreme to another, for instance, "Strongly Disagree" to "Strongly Agree" or "Very Unsatisfied" to "Very Satisfied." Crucially, the scale includes a neutral midpoint, often labeled "Neither Agree nor Disagree" or "Neutral," which allows respondents who don't have a strong opinion to avoid forced choices. This balanced approach contributes to more accurate data collection. The responses are then assigned numerical values, enabling statistical analysis and comparisons across different groups or over time.
The features that make Likert scale questions so effective include the symmetric rating scale (usually 5 or 7 points), the neutral midpoint option, the quantifiable nature of responses for statistical analysis, and the consistent response format that can be used across multiple questions within a survey. This consistency simplifies the response process for participants and facilitates data interpretation.
Examples of Successful Implementation:
- Customer Satisfaction Surveys: "How satisfied are you with our customer service?" (Very Unsatisfied to Very Satisfied)
- Employee Engagement Surveys: "I feel valued at work." (Strongly Disagree to Strongly Agree)
- Product Feedback: "The product met my expectations." (1-5 scale)
- Market Research: "How likely are you to recommend this product to a friend?" (Not at all likely to Extremely likely)
Pros of Using Likert Scale Questions:
- Easy for Respondents: Simple to understand and complete, leading to higher completion rates.
- Quantifiable Data: Provides numerical data suitable for statistical analysis, allowing for comparisons and trend identification.
- Statistical Analysis: Facilitates a range of statistical analyses, including calculating averages, standard deviations, and conducting t-tests or correlations.
- High Response Rates: The ease of completion contributes to better response rates compared to more complex question formats.
Cons of Using Likert Scale Questions:
- Response Bias: Susceptible to biases such as central tendency (respondents gravitating towards the neutral option) and acquiescence bias (tendency to agree with statements regardless of content).
- Cultural Differences: Interpretation of scales can vary across cultures, impacting the validity of comparisons.
- Limited Depth: Compared to open-ended questions, Likert scales offer less opportunity for respondents to elaborate on their views, potentially missing nuanced opinions.
- Oversimplification: May not capture the full complexity of attitudes or opinions, particularly on sensitive or multifaceted issues.
Tips for Effective Use:
- Clear Language: Use concise and unambiguous language in your statements to avoid confusion.
- Consistent Scale Direction: Maintain the same scale direction (e.g., positive to negative or vice-versa) throughout the survey for consistency.
- 7-Point Scales for Granularity: Consider using 7-point scales when seeking more granular data, although 5-point scales are generally sufficient.
- Balanced Statements: Include both positive and negative statements to mitigate acquiescence bias.
The following infographic visualizes data related to the usage and effectiveness of Likert scale questions. Specifically, it shows the prevalence of 5-point versus 7-point scales and the average completion rate for surveys using this question type.
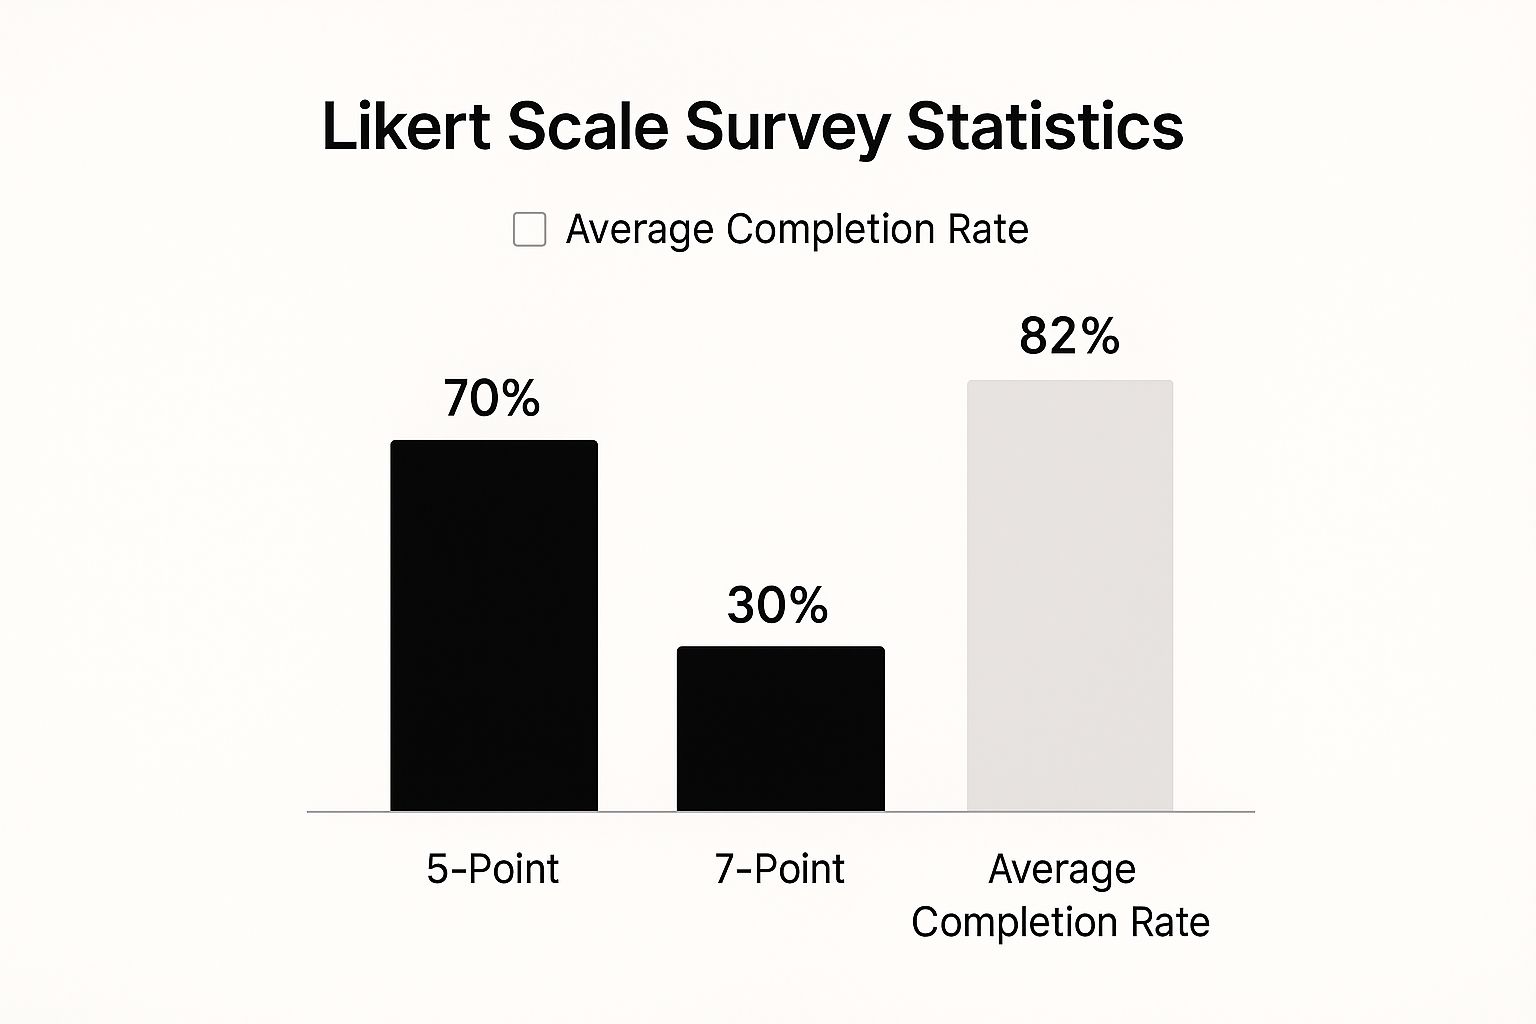
As the infographic illustrates, 5-point Likert scales are more commonly used (70%) compared to 7-point scales (30%), and Likert-scale surveys boast a high average completion rate of 82%. This data highlights the popularity and effectiveness of Likert scales as a survey question format.
Likert scale questions are invaluable for anyone seeking to collect quantifiable data on attitudes and opinions. They are particularly beneficial for marketing professionals, product managers, entrepreneurs, and anyone needing to gather feedback efficiently. The simplicity, versatility, and actionable insights provided by Likert scales make them an essential tool in the survey designer's toolkit. They represent a powerful way to understand your target audience, improve products and services, and make data-driven decisions.
2. Net Promoter Score (NPS) Questions
When seeking concise yet powerful survey questions examples, the Net Promoter Score (NPS) question stands out as a crucial tool for understanding customer loyalty and satisfaction. This simple, yet effective metric gauges how likely a customer is to recommend your product, service, or company to others, providing valuable insights into customer relationships and potential for growth. As a marketing professional, product manager, entrepreneur, or even a developer looking to integrate feedback mechanisms, understanding the nuances of NPS questions is invaluable for data-driven decision-making.
The core of the NPS question revolves around a single, straightforward query: "On a scale of 0 to 10, how likely are you to recommend [your company/product/service] to a friend or colleague?" Respondents choose a number between 0 and 10, with 0 representing "Not at all likely" and 10 representing "Extremely likely." This single 0-10 rating scale question then automatically categorizes respondents into three distinct groups:
- Promoters (9-10): These are your loyal enthusiasts, likely to spread positive word-of-mouth and drive organic growth. They are your brand champions.
- Passives (7-8): Satisfied but not necessarily enthusiastic, these customers are susceptible to competitive offerings and may not actively promote your brand.
- Detractors (0-6): Unhappy customers who may churn and potentially damage your brand reputation through negative feedback. Addressing their concerns is paramount.
The NPS score itself is calculated by subtracting the percentage of Detractors from the percentage of Promoters. This provides a single, easily digestible metric that can be tracked over time, benchmarked against industry standards, and communicated effectively to stakeholders. It serves as a valuable indicator of customer loyalty and potential for business growth, making it a widely recognized metric amongst executives.
The strength of NPS lies in its simplicity and standardization. It offers a common language for discussing customer experience across industries, facilitating internal alignment and external benchmarking. Companies like Apple, Amazon, and countless SaaS businesses leverage NPS to gauge customer satisfaction and identify areas for improvement. For example, Apple frequently uses NPS questions in post-purchase customer feedback surveys to understand customer sentiment towards their latest products. Similarly, Airbnb uses NPS in post-stay guest experience surveys to assess satisfaction with hosts and accommodations. These survey questions examples demonstrate how NPS can be implemented across diverse business models.
While the simplicity of NPS is a significant advantage, it’s important to be aware of its limitations. Cultural variations can influence rating tendencies, making cross-cultural comparisons challenging. Furthermore, relying solely on a single metric may oversimplify the complexities of customer relationships and fail to capture the nuances of the entire customer experience. The score can also be swayed by recent experiences, rather than reflecting overall, long-term satisfaction.
To maximize the value of NPS questions, it's crucial to implement them effectively:
- Always include a follow-up open-ended question asking "Why?" This provides invaluable context and qualitative insights into the numerical rating, allowing you to understand the drivers of satisfaction and dissatisfaction.
- Survey customers at consistent touchpoints throughout the customer journey. This provides a longitudinal view of customer sentiment and allows you to identify trends and pinpoint areas for improvement.
- Segment NPS by customer demographics or product lines. This helps you identify specific customer segments or product areas that require attention.
- Act on the feedback received. Closing the loop with respondents, particularly Detractors, demonstrates that their feedback is valued and can turn negative experiences into positive ones.
The Net Promoter Score, popularized by Fred Reichheld of Bain & Company, Satmetrix, and championed by companies like Apple and Amazon, provides a powerful and efficient way to measure customer loyalty and predict business growth. By understanding its strengths and limitations, and implementing it strategically, you can leverage the NPS question to gain valuable insights into your customer base and drive improvements across your organization. This is why it deserves its place in any list of effective survey questions examples.
3. Multiple Choice Questions
Multiple choice questions are a staple in surveys, offering a structured and efficient way to collect data from respondents. They present a predefined list of answer options, allowing participants to select the most appropriate choice(s). This method simplifies the response process, making it quick and easy for participants while providing researchers with clean, quantifiable data. The structured nature of multiple choice questions makes them particularly well-suited for online surveys and mobile devices, where typing lengthy responses can be cumbersome. Their versatility stems from the ability to offer single-select or multi-select options, catering to various data collection needs. This allows you to gather specific categorical data efficiently, making them a valuable tool for everything from market research to customer satisfaction surveys.

Multiple choice questions excel in scenarios where you need to gather structured data quickly and efficiently. Their predefined answer options reduce response variability and make analysis straightforward. This question type is invaluable for collecting demographic information (age, gender, location), understanding product preferences (features, pricing), gauging customer satisfaction (ratings, feedback), and conducting market research (brand awareness, competitor analysis). For example, a product manager could use multiple choice questions to quickly gather feedback on preferred features for a new software release. Similarly, a marketing professional could use them to understand customer demographics and tailor campaigns more effectively. Entrepreneurs and startups can leverage these questions to validate ideas and gather market insights without complex technical setups. Developers can utilize multiple choice questions in forms to streamline data collection and automate processes, focusing their efforts on core engineering tasks. Even non-technical business users in HR or customer support can easily create ad-hoc forms with multiple choice questions to collect information without requiring coding skills.
The ability to offer both single and multiple selections broadens their applicability. Single-select questions, using radio buttons, are ideal when only one answer is appropriate (e.g., "What is your age group?"). Multi-select questions, using checkboxes, allow respondents to choose multiple applicable options (e.g., "Which features are most important to you?"). The inclusion of an "Other" option with a free-text field further enhances flexibility, capturing responses not covered by the predefined options. This ensures that respondents have a way to express their views even if the provided choices don't fully capture their perspective. This "Other" option can provide valuable qualitative insights that can supplement the quantitative data from the predefined choices.
While multiple choice questions offer numerous advantages, including ease of completion for respondents, clean and categorizable data, and mobile-friendliness, they also have limitations. Predefined options, while streamlining the process, may not capture all possible responses. The provided choices might inadvertently lead respondents towards specific answers, potentially introducing bias. The order in which options are presented can also influence responses, a phenomenon known as response order bias. Finally, multiple choice questions provide limited insight into the reasoning behind respondents' choices, offering a surface-level understanding of their perspectives.
To maximize the effectiveness of multiple choice questions in your surveys, consider these tips:
- Include an "Other" option: When appropriate, offer an "Other" option with a text field to capture responses not covered by the predefined choices. This is especially useful when you're not entirely certain about the full range of potential answers.
- Keep options mutually exclusive and exhaustive: Ensure that options don't overlap and that they cover all relevant possibilities. This clarity prevents confusion and ensures accurate data collection.
- Randomize option order: Vary the order in which options are presented to different respondents to mitigate response order bias. This ensures that no single option benefits from its position in the list.
- Limit the number of options: For optimal user experience, particularly on mobile devices, avoid overwhelming respondents with too many choices. Aim for 7-10 options or fewer whenever possible. More options can lead to respondent fatigue and less accurate data.
Multiple choice questions are a powerful tool in any researcher's arsenal. From educational testing giants like ETS and Pearson to market research firms like Nielsen and Ipsos, and across popular survey platforms such as SurveyMonkey and Typeform, their widespread adoption speaks to their utility and effectiveness in gathering structured data efficiently. By understanding their strengths and limitations and following best practices, you can leverage multiple choice questions to collect valuable insights and make data-driven decisions.
4. Open-Ended Questions
Open-ended questions represent a powerful tool in the arsenal of survey questions examples, offering a unique approach to gathering rich, qualitative data. Unlike their close-ended counterparts which restrict responses to pre-defined options, open-ended questions allow respondents to express themselves freely in their own words. This freedom unlocks a wealth of nuanced insights, unexpected feedback, and a deeper understanding of the subject matter, making them invaluable for exploring complex topics and uncovering hidden perspectives. This type of survey question is particularly useful for anyone seeking in-depth feedback, from marketing professionals to product managers, entrepreneurs, and even developers looking for qualitative data.
Open-ended questions utilize a free-text response format, meaning no predefined answer constraints exist. This allows respondents to elaborate on their thoughts, explain their reasoning, and provide context that simply isn't possible with multiple-choice or rating-scale questions. This makes them ideal for capturing nuanced opinions, personal experiences, and detailed explanations. For instance, instead of asking customers to rate their satisfaction on a scale of 1-5, an open-ended question like “How could we improve your experience?” encourages them to articulate specific suggestions and paint a clearer picture of their needs. This kind of qualitative data helps you understand the why behind the what, providing actionable insights that go beyond simple metrics.
The benefits of incorporating open-ended questions into your surveys are numerous. They provide rich, detailed insights that go beyond surface-level responses, capturing unexpected feedback and innovative ideas that might otherwise be missed. They also allow respondents to express complex thoughts and feelings in their own language, revealing valuable information about the terminology and phrasing used by your target audience. Imagine a product manager trying to understand user frustrations with a new feature. A simple “yes/no” question about satisfaction wouldn't provide the same level of detail as asking "What are the biggest challenges you face when using this feature?" The open-ended question unveils the specific pain points users experience, guiding product development and improvement more effectively.
However, open-ended questions also present certain challenges. They are more time-consuming for respondents to complete, which can lead to lower response rates compared to quicker, closed-ended questions. Analyzing the data can also be more complex and resource-intensive, especially at scale. The free-form nature of the responses necessitates qualitative analysis techniques, often involving manual review, coding, and thematic analysis. While software tools can assist with text analysis and sentiment detection, the process remains more involved than simply calculating percentages from multiple-choice responses. Moreover, there's a risk of receiving irrelevant or off-topic responses, requiring careful filtering and interpretation.
Despite these challenges, the rich insights gained from open-ended questions often outweigh the drawbacks, especially when used strategically. For example, customer feedback surveys can utilize open-ended questions like "What improvements would you suggest for our service?" to gather specific recommendations. In employee surveys, a question like "Describe your ideal work environment" can uncover underlying issues related to company culture and employee satisfaction. Product development can benefit from questions like "What challenges do you face with current solutions?" to identify unmet needs and inform innovation. Even understanding brand perception can be enhanced with open-ended questions like "What words would you use to describe our company?" providing valuable insights into brand image and resonance.
To maximize the effectiveness of open-ended questions in your surveys, consider the following tips:
- Use specific prompts to guide responses: Avoid overly broad questions like "What do you think?" Instead, provide context and focus with prompts like "What are your thoughts on the new website design?"
- Combine with closed questions for a mixed-method approach: Use closed questions to gather quantifiable data and open-ended questions to explore the "why" behind the numbers. This provides a more comprehensive understanding.
- Implement text analytics tools for large-scale analysis: Software solutions can help automate the analysis of large volumes of text data, identifying key themes, sentiments, and trends.
- Provide adequate space/character limits for responses: Ensure respondents have enough room to express their thoughts fully. Clearly defined character limits can also help manage response length.
Open-ended questions have been popularized by qualitative research methodologists, anthropologists, ethnographers, user experience researchers, and customer feedback platforms like Medallia and Qualtrics. Their use continues to grow as organizations recognize the value of in-depth, qualitative data for understanding their customers, employees, and target audiences. By incorporating open-ended questions strategically into your survey design and employing best practices for analysis, you can unlock a treasure trove of insights that drive informed decision-making and lead to meaningful improvements. When seeking truly rich survey questions examples, open-ended questions deserve a prominent place in your toolkit.
5. Ranking Questions
Ranking questions represent a powerful tool in the arsenal of survey question examples, allowing you to delve deeper into respondent preferences and priorities. Unlike rating scales where respondents evaluate items individually, ranking questions require them to compare items against each other and arrange them in order of preference, importance, or priority. This forced comparison provides valuable insights into the relative importance of different options, helping you understand what truly matters most to your target audience when they are compelled to make comparative choices. This approach is particularly valuable for marketing professionals, product managers, and entrepreneurs who need to prioritize features, benefits, or messaging.

Ranking questions typically utilize a drag-and-drop or numbered ranking interface. Respondents are presented with a list of items and asked to arrange them in a specific order. This could involve a complete ranking of all items or a partial ranking, such as asking respondents to rank only their top three choices. This flexibility allows you to tailor the question to the complexity of the topic and the cognitive load on the respondent. For example, a product manager might ask users to rank the importance of five proposed features for a new software release. This forces users to prioritize amongst the features and gives the product team clearer direction.
One of the key advantages of ranking questions is their ability to reveal relative importance rather than absolute ratings. This helps mitigate response bias, a common issue with rating scales where respondents may tend to rate everything highly. By forcing respondents to prioritize, ranking questions provide a clearer understanding of their true preferences. For instance, while a customer might rate both "product quality" and "customer service" as "very important" on a rating scale, a ranking question would reveal which of these factors they prioritize more highly when forced to choose. This nuanced understanding is crucial for decision-making, particularly in areas like resource allocation and product development.
However, ranking questions also come with certain limitations. They can be cognitively demanding for respondents, especially when dealing with long lists of items. This can be particularly problematic on mobile devices, where the drag-and-drop or numbered ranking interfaces can be cumbersome. In such cases, partial ranking or limiting the number of items can improve the user experience. There's also the risk that long, complex ranking questions may lead to survey abandonment. Finally, ranking questions assume a linear relationship between preferences, which may not always be the case in reality. A respondent might strongly prefer A over B and B over C, but have only a marginal preference for A over C. Ranking questions don't capture this nuance.
Here are some further examples of how ranking questions can be applied in various contexts:
- Product Features: "Rank these features by importance" (Price, Quality, Design, Support, Battery Life, etc.)
- Marketing Channels: "Rank these information sources by trustworthiness" (Website, Social Media, Email, TV Ads, Print Ads, etc.)
- HR Priorities: "Rank these benefits by desirability" (Health insurance, Flexible hours, Remote work, Paid time off, Professional development, etc.)
- Brand Attributes: "Rank these brands by preference" (Nike, Adidas, Puma, Reebok, Under Armour, etc.)
To ensure effective implementation of ranking questions in your surveys, consider the following tips:
- Limit the number of items: Ideally, keep the list to 5-7 items for optimal user experience. Longer lists increase cognitive load and can lead to respondent fatigue.
- Provide clear instructions: Clearly explain the ranking method (e.g., drag-and-drop, numbering) and what criteria respondents should use for ranking (e.g., importance, preference).
- Consider partial ranking: For longer lists, consider asking respondents to rank only their top 3 or 5 choices rather than the entire list.
- Test interface usability: Test the ranking interface on different devices (desktop, mobile, tablet) to ensure it is user-friendly and accessible.
Ranking questions, popularized by researchers in conjoint analysis and MaxDiff methodology, are now a common tool used by UX research teams at major tech companies and are increasingly accessible to anyone designing a survey. They offer a valuable way to gain deeper insights into respondent preferences and prioritize key features, benefits, or messaging. By understanding their strengths and limitations and following best practices, you can effectively leverage ranking questions to improve your survey data and make more informed decisions.
6. Matrix/Grid Questions: Streamlining Survey Data Collection
Matrix/grid questions are a powerful tool in the surveyor's arsenal, offering a structured and efficient way to gather data on multiple related items within a single question format. This approach presents respondents with a grid layout, where rows represent individual items and columns represent a rating scale or set of criteria. This method significantly streamlines the survey experience for both the respondent and the analyst, making it a valuable addition to any survey questions examples list. For marketing professionals, product managers, entrepreneurs, and even developers seeking efficient feedback mechanisms, matrix questions provide a structured and concise approach to data collection.
Imagine you’re a product manager trying to understand user satisfaction with various features of your new software. Instead of asking individual questions about each feature, a matrix question allows you to present all features in a grid, letting respondents rate each one on a scale (e.g., "Very Satisfied" to "Very Dissatisfied"). This not only saves space and reduces survey fatigue but also provides easily comparable data across all features. This method resonates with our target audience – those seeking faster campaign deployment, rapid user feedback, and streamlined data analysis.
How Matrix/Grid Questions Work:
The core structure of a matrix question involves a table format. Each row represents a specific item or statement, and each column represents a point on a rating scale. Respondents mark their response for each item based on the provided scale. This consistent rating format across all items facilitates easy comparison and analysis of the collected data. For example, an HR department conducting an employee satisfaction survey might list different aspects of the job (e.g., Compensation, Work-Life Balance, Management) as rows and a satisfaction scale (e.g., "Strongly Agree" to "Strongly Disagree") as columns.
Features and Benefits:
- Grid Layout: The clear row and column structure allows for efficient presentation of multiple items and rating options.
- Consistent Rating Scale: Using the same scale across all items ensures comparability and simplifies data analysis.
- Space-Efficient: Consolidates multiple related questions into a single format, shortening the overall survey length.
- Flexibility: Allows for single or multiple response options per row, catering to various data collection needs.
- Easy Comparison: Facilitates quick comparisons of respondent ratings across different items.
Examples of Successful Implementation:
- Market Research: Evaluating brand perception by asking respondents to rate different brands on attributes like quality, value, and innovation.