The Hidden Science of Political Polling: A Complete Guide to How Polls Really Work
We’ve all seen it. The headline flashes across your screen: "Candidate A Surges to a 5-Point Lead!" Then, on election night, Candidate B wins by a comfortable margin. The result is a collective groan and a familiar question: "Are political polls just useless?"
It’s easy to be cynical. When the predictions don't match the outcome, it feels like the entire system is broken. But the truth is more complex and, frankly, more interesting. Political polling isn't magic; it's a science-a rigorous discipline of statistics, sociology, and modeling. According to the Pew Research Center, while public trust in many institutions has declined, understanding the how behind the numbers is the first step to becoming a more informed citizen.
The problem isn't always that the polls are "wrong." It's that the political polling methods they use are often misunderstood. A poll isn't a crystal ball. It's a snapshot in time, a carefully constructed estimate with built-in limitations.
In this guide, we'll pull back the curtain. We'll explain how political polls are actually conducted, from the science of sampling to the misunderstood "margin of error." You'll learn why getting an accurate reading of public opinion is one of the toughest challenges in data science—and how to spot a good poll from a bad one.
Table of Contents
- What is a Political Poll, Really?
- The Heart of the Matter: How Sampling Works
- Decoding the Margin of Error: What It Actually Means
- The Secret Sauce: Weighting and Likely Voter Models
- Why Polls Sometimes Get It Wrong
- How to Be a Smart Consumer of Political Polls
What is a Political Poll, Really?
At its core, a political poll is a scientific instrument designed to measure the opinions of a specific group of people (the "population") by surveying a small, representative slice of that group (the "sample").
Think of it like a chef tasting a spoonful of soup. The chef doesn't need to drink the entire pot to know if it needs more salt. They stir the pot thoroughly (ensuring it's mixed) and taste a single spoonful. That small taste gives them a very good idea of the entire pot's flavor.
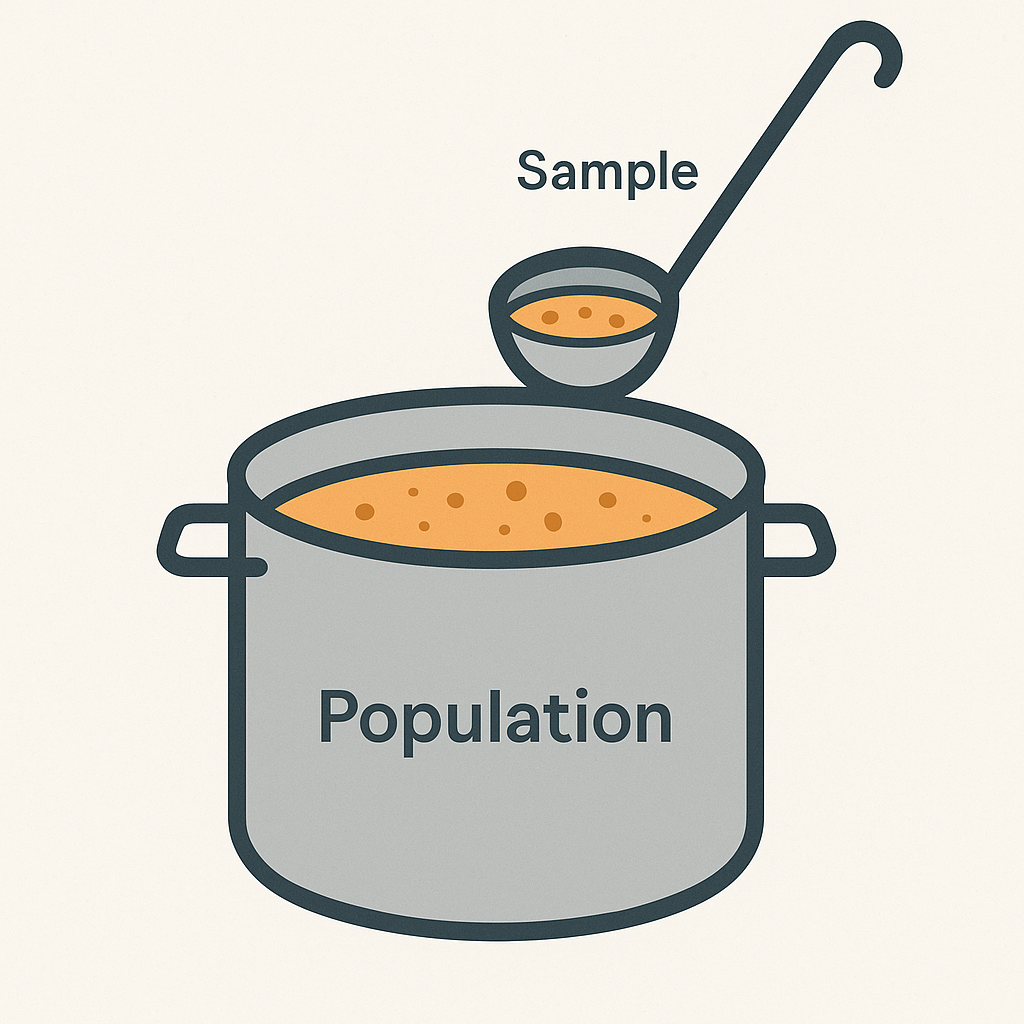
A scientific poll works on the same principle. The "pot of soup" is the entire electorate—say, all adults in the United States. The "spoonful" is the sample of 1,000 or so people the pollster contacts. The "stirring" is the crucial process of random and representative sampling, which ensures the spoonful accurately reflects the whole pot.
The Heart of the Matter: How Sampling Works
The accuracy of any poll depends entirely on the quality of its sample. If you only taste the salty bits of the soup, you'll get a misleading impression. Similarly, if a poll only surveys one type of person, its results will be skewed. The goal is to create a miniature version of the electorate.
This is achieved through a few key political polling methods:
- Random Sampling: This is the gold standard. In a true random sample, every single person in the target population has an equal chance of being selected. This is crucial for avoiding bias. In the early days of polling, this was often done using random-digit dialing of landline phones.
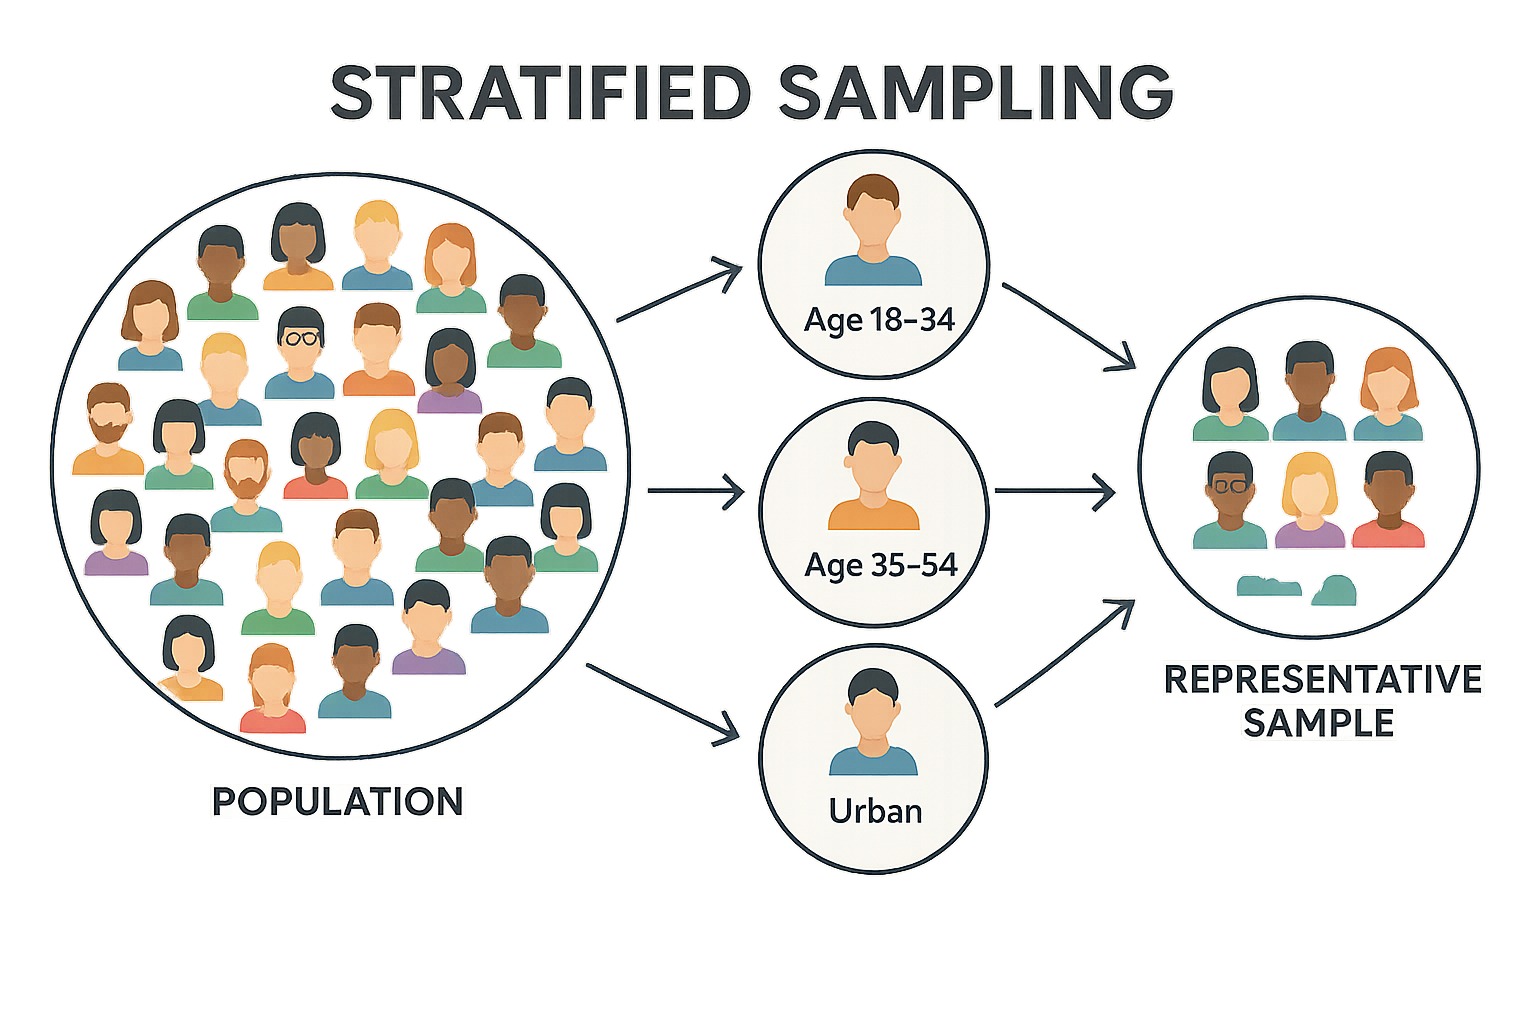
- Stratified Sampling: This is a more sophisticated approach. Pollsters first divide the population into important subgroups, or "strata," based on demographics like age, gender, race, and geographic location. They then conduct random sampling within each of those groups to ensure the final sample’s demographics match the population's actual proportions. For example, if a state is 52% female, the pollster will ensure their final, weighted sample is also 52% female.
The Modern Challenge: Reaching Real People
The days of easily reaching people on their landlines are long gone. As people who build tools to gather data, we at FormLink.ai have a deep respect for how hard this has become. Pollsters now face huge hurdles:
- Caller ID & Spam Filters: Most people don't answer calls from unknown numbers.
- The Decline of Landlines: Many younger and more mobile populations only have cell phones, which are more difficult and expensive to call for polling purposes.
- Online Panels: Many polls have moved online, using panels of pre-recruited participants. While efficient, this raises questions about whether these panels are truly representative of the general population or just people who like taking surveys.
Getting a truly random and representative sample is harder and more expensive than ever, which is the first place errors can creep in.
Decoding the Margin of Error: What It Actually Means
You'll always see this phrase attached to a poll: "a margin of error of plus or minus 3 percentage points." This is one of the most misunderstood concepts in polling.
The margin of error is not a measure of mistakes. It's a measure of statistical confidence. It acknowledges that since we're only surveying a sample, there's a small chance that the sample's opinion is slightly different from the entire population's opinion.
Here's a better analogy: think of the margin of error like a weather forecast. When the meteorologist says the high will be 75°F with a +/- 3° margin, they're telling you they are very confident the actual temperature will fall somewhere between 72°F and 78°F.
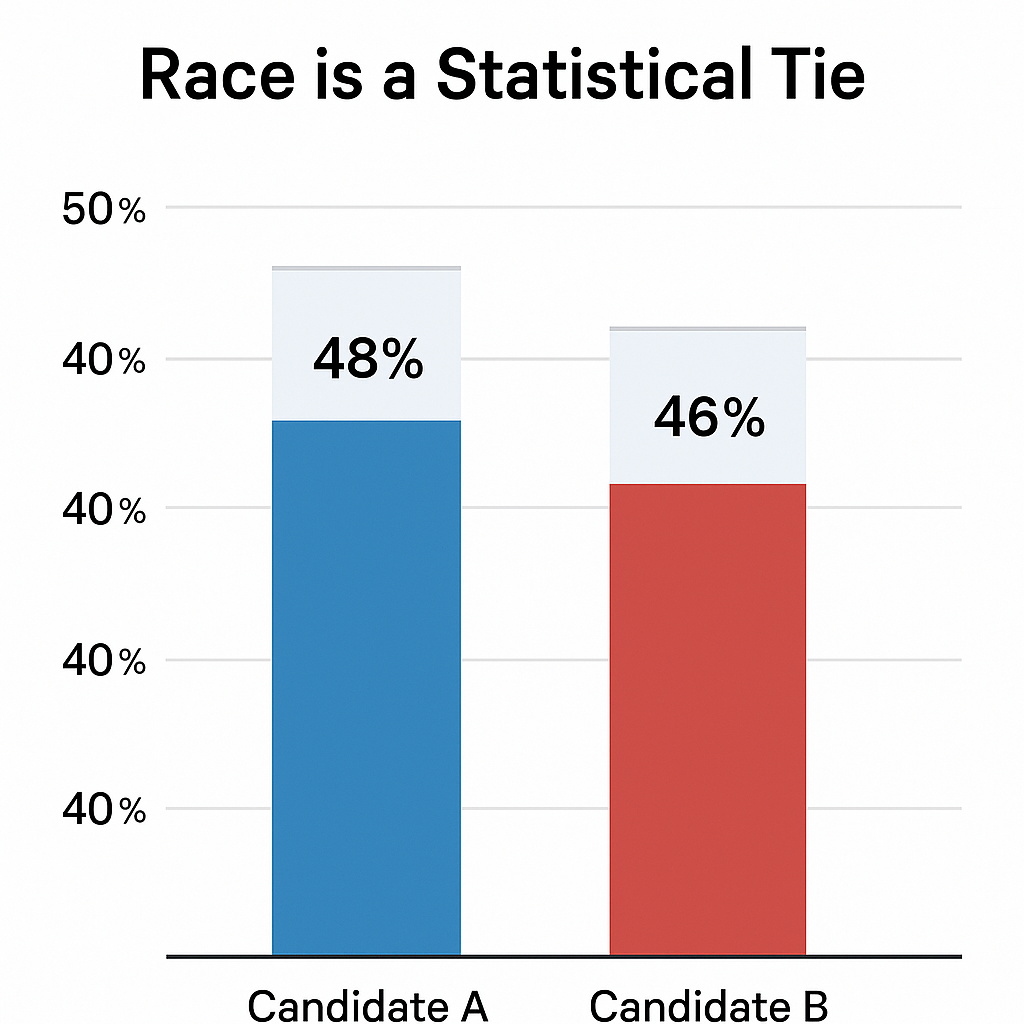
It’s the same with a poll. If Candidate A is polling at 48% with a 3% margin of error, the pollster is confident their true support among the entire population is somewhere between 45% and 51%.
This is why a "statistical tie" is so important. If Candidate A is at 48% and Candidate B is at 46% with a +/- 3% margin of error, their ranges of potential support (45-51% for A, 43-49% for B) overlap significantly. The headline might say A is "ahead," but the race is too close to call.
The Secret Sauce: Weighting and Likely Voter Models
Even with the best sampling, a raw sample is never a perfect mirror of the population. Some groups are just harder to reach. For example, a poll might get too many responses from older, retired women and not enough from young, working men.
This is where weighting comes in. Pollsters adjust the "weight" of responses from underrepresented groups upwards and the weight of overrepresented groups downwards. It's like adding a little more salt to one part of the soup to ensure the overall flavor is balanced. This process is essential for making the final results align with the known demographics of the population, as documented by sources like the U.S. Census Bureau.
But the biggest challenge of all is figuring out who will actually vote. This is where how are political polls conducted moves from a science to an art form. Pollsters build "likely voter" models by asking questions designed to gauge a person's intent and past behavior, such as:
- "How closely have you been following the election?"
- "Do you know where your polling place is?"
- "Did you vote in the last midterm election?"
Based on the answers, pollsters create a screen, filtering out registered voters who probably won't show up. This model is a pollster's "secret sauce," and a bad model is often why polls in the final days before an election can be wrong.
Why Polls Sometimes Get It Wrong
Despite all this science, polls can and do miss the mark. The 2016 U.S. Presidential election is a famous example. While national polls were quite accurate, many state-level polls underestimated support for Donald Trump. An in-depth analysis by the American Association for Public Opinion Research (AAPOR) pointed to a few key reasons, which highlight the common challenges:
- Late Deciders: A significant number of voters made their decision in the final week, and they broke heavily for one candidate. Polls can't capture a last-minute swing.
- Weighting by Education: Fewer polls weighted their samples by education level. College-educated and non-college-educated voters behaved very differently, and not accounting for that skewed the results in key states.
- Non-response Bias: This is the elephant in the room. If the people who consistently refuse to answer polls are systematically different from those who do, the sample will be biased in a way that's nearly impossible to correct for.
How to Be a Smart Consumer of Political Polls
You don't need a Ph.D. in statistics to be a savvy reader of polls. The next time you see a polling headline, don't just look at the top-line numbers. Dig a little deeper.
- Who conducted the poll? Stick to reputable, non-partisan pollsters like major universities, news organizations (AP, Reuters), and established firms (Pew Research, Gallup, YouGov).
- What was the sample size and margin of error? A sample of 200 people is not as reliable as a sample of 2,000.
- How was the poll conducted? Was it live-caller, IVR (robocall), or online? Live-caller polls are generally considered the most reliable, though they are also the most expensive.
- Look at the trend, not a single poll. The average of several polls over time is always more meaningful than any single poll, which could be an outlier. Websites like FiveThirtyEight provide excellent poll aggregation.
Conclusion: A Tool, Not a Prophecy
Political polls are not broken. They are a vital tool for understanding the will of the people in a democracy. But they are also complex instruments with real limitations. They measure probabilities, not certainties, and they depend on the messy, unpredictable world of human behavior.
The goal isn't to find the one "perfect" poll. The goal is to understand the methodology, respect the uncertainty, and use the data as one tool among many for understanding the political landscape.
While the science of political polling remains a complex field, gathering feedback for your business or project shouldn't be. You don't need a likely voter model to understand your customers. You just need a simple, effective way to ask.
More Resources
- Pew Research Center: Public Opinion Polling Basics
- FiveThirtyEight: Pollster Ratings
- Roper Center for Public Opinion Research at Cornell University: Polling Fundamentals