The Ultimate Guide to Likert Scale Examples (And How to Use Them)
Let's be honest. You've poured hours into a new feature, shipped it, and sent out a feedback survey. The results come in, and they're... useless. Vague, unhelpful responses like "It's fine" or a meaningless "3 out of 5." You're left with no real insight into what users actually think.
The problem isn't your users; it's your questions. Getting nuanced feedback is a craft, and the most important tool in your workshop is the Likert scale. According to a study from the University of Florida, the way you phrase a question and the scale you provide can dramatically alter the responses you receive, highlighting the need for careful design.
This guide provides a masterclass in using Likert scale examples effectively. We'll go beyond the basics to show you how to craft questions that deliver clear, actionable insights. We'll cover the great 5-point vs. 7-point debate, provide 20+ examples you can use today, and show you how to avoid the common pitfalls that lead to bad data.
Table of Contents
- What is a Likert Scale, Really?
- The Great Debate: 5-Point vs. 7-Point Scales
- 20+ Powerful Likert Scale Examples
- Measuring Satisfaction
- Gauging Agreement
- Understanding Frequency
- Assessing Likelihood & Importance
- 4 Rules for Writing Good Likert Scale Questions
- Why Traditional Likert Scales Are Broken (And How AI Can Help)
What is a Likert Scale, Really?
First, let's clear up a common misconception. A Likert scale (named after its creator, Rensis Likert) is technically the sum of responses to multiple questions (items). However, the term is now universally used to describe a single question that uses a rating scale with a range of ordered responses to measure an opinion or attitude.
Think of it like a dimmer switch for opinions, not an on/off button. Instead of a simple "yes/no," it captures the degree of sentiment. This is crucial for understanding nuance.
On first use, we must define the jargon: A Likert item is the question itself, while a Likert scale is the result of adding up the scores from several related items to measure a single, complex attitude. For this guide, we'll stick to the common usage and focus on individual questions.
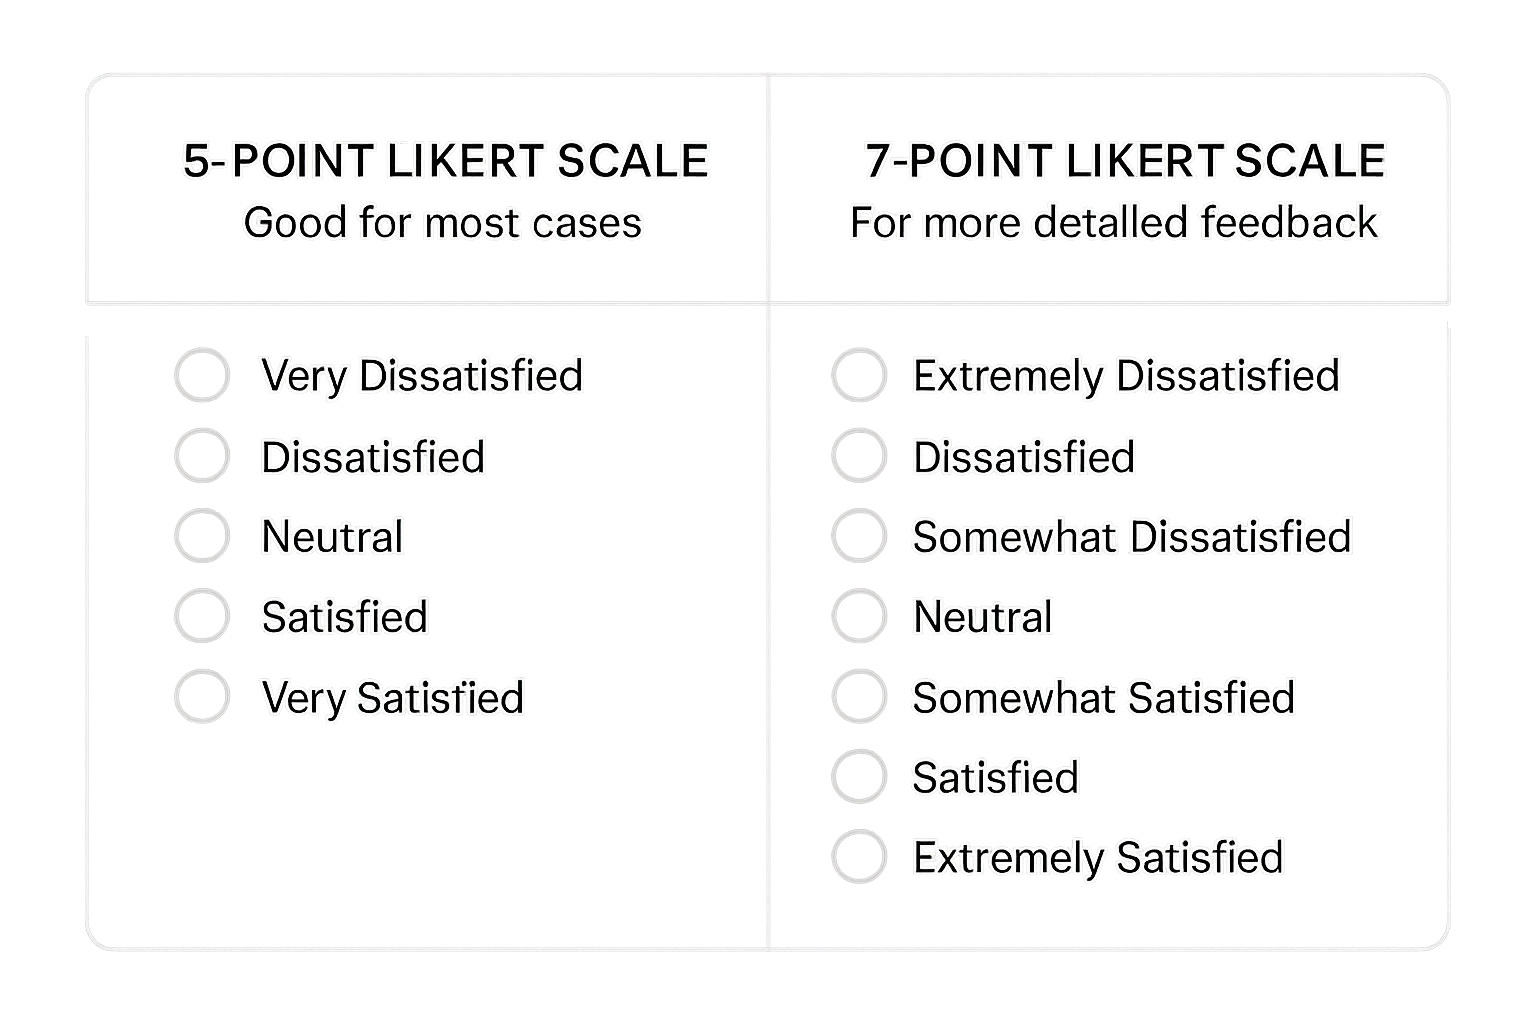
The Great Debate: 5-Point vs. 7-Point Scales
The most common question we hear is, "Should I use a 5-point or a 7-point scale?" The answer is: it depends on how much detail you need.
- The 5-Point Scale: This is the workhorse. It's simple, intuitive, and reduces survey fatigue. It's perfect for most general feedback.
- The 7-Point Scale: This offers more granularity. The extra two points allow for finer shades of opinion, which can be valuable in detailed user research or academic studies.
An analogy I like is comparing a standard photo to a high-resolution one. The standard photo (5-point) gets the job done and is easy to handle. The high-res photo (7-point) captures more detail, but the file is bigger and might be overkill for a simple snapshot.
A key feature of both is the "neutral" midpoint (e.g., "Neither agree nor disagree"). Some researchers argue for removing it to force a choice, but this can frustrate users who genuinely have no opinion. At FormLink.ai, we believe giving users an honest "out" is better than forcing them to pollute your data with a random choice.
20+ Powerful Likert Scale Examples You Can Use Today
Here are battle-tested examples for common use cases. Steal them, adapt them, and use them to get better data.
1. Measuring Satisfaction (The Classic)
This is where you'll often find the 5 point likert scale examples for satisfaction that so many people search for.
Question: Overall, how satisfied are you with our product?
- Scale: Very Satisfied | Satisfied | Neutral | Dissatisfied | Very Dissatisfied
Question: How satisfied were you with the support you received today?
- Scale: Very Satisfied | Satisfied | Neutral | Dissatisfied | Very Dissatisfied
Question: How would you rate the quality of our new dashboard?
- Scale: Very High Quality | High Quality | Average | Low Quality | Very Low Quality
Question: How satisfied are you with the onboarding process?
- Scale: Extremely Satisfied | Satisfied | Neutral | Dissatisfied | Extremely Dissatisfied
2. Gauging Agreement
Agreement scales are perfect for validating hypotheses about your product or service.
Statement: The new user interface is easy to navigate.
- Scale: Strongly Agree | Agree | Neutral | Disagree | Strongly Disagree
Statement: The documentation provided was helpful.
- Scale: Strongly Agree | Agree | Neutral | Disagree | Strongly Disagree
Statement: I feel that the pricing for this service is fair.
- Scale: Strongly Agree | Agree | Neutral | Disagree | Strongly Disagree
Statement: FormLink.ai is a valuable tool for our team.
- Scale: Strongly Agree | Agree | Neutral | Disagree | Strongly Disagree
3. Understanding Frequency
Frequency scales help you understand user habits and behavior patterns.
Question: How often do you use our mobile app?
- Scale: Every Day | A Few Times a Week | Once a Week | A Few Times a Month | Rarely or Never
Question: How frequently do you need to contact customer support?
- Scale: Very Frequently | Frequently | Occasionally | Rarely | Never
Question: How often do you use the advanced reporting features?
- Scale: Always | Often | Sometimes | Rarely | Never
4. Assessing Likelihood & Importance
These are great for product prioritization and understanding user intent.
Question: How likely are you to recommend our product to a friend or colleague? (This is the Net Promoter Score or NPS question)
- Scale: A 0-10 scale where 0 is 'Not at all likely' and 10 is 'Extremely likely'.
Question: How important is [X feature] to your workflow?
- Scale: Very Important | Important | Moderately Important | Slightly Important | Not at all Important
Question: How likely are you to renew your subscription?
- Scale: Very Likely | Likely | Unsure | Unlikely | Very Unlikely
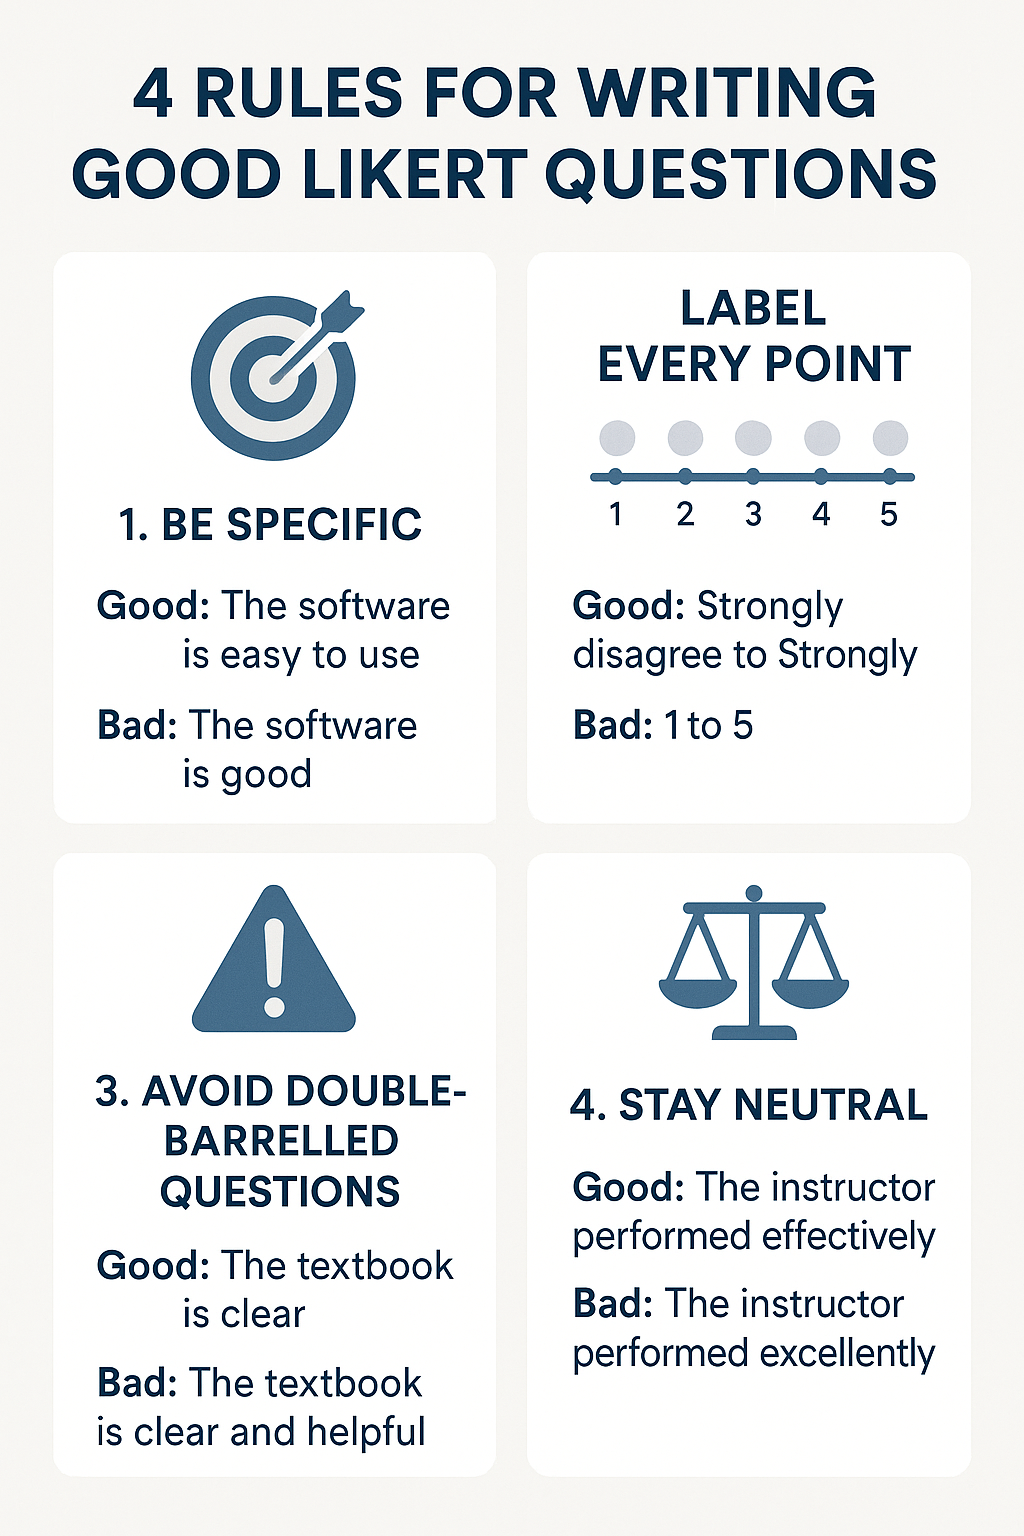
4. Rules for Writing Good Likert Scale Questions
Providing examples isn't enough. You need to know why they work. Back when I was working on product teams at larger tech companies, we learned that bad questions were the single biggest source of project-killing data.
- Be Specific: Avoid vague questions.
- Bad: How do you like our software?
- Good: How satisfied are you with the speed of the report generation feature?
- Label Every Point: Don't just label the endpoints (1 and 5). Labeling each point on the scale reduces ambiguity and ensures everyone interprets the scale the same way. This is a non-negotiable for data integrity.
- Avoid Double-Barreled Questions: Don't ask two things in one question.
- Bad: How would you rate the speed and reliability of our app? (What if it's fast but unreliable?)
- Good: Split it into two separate questions.
- Stay Neutral: Don't lead the user. Your question should be unbiased.
- Bad: Don't you agree that our new design is much better?
- Good: How would you rate the new design compared to the old one?
Why Traditional Likert Scales Are Broken (And How AI Can Help)
Here's the hard truth: even the best-designed Likert scale survey can be a drag. Staring at a wall of radio buttons is boring, and unengaged users give lazy answers. The breaking point for me, and the reason we started FormLink.ai, was spending an entire afternoon building a "simple" feedback form that I knew people would hate filling out.
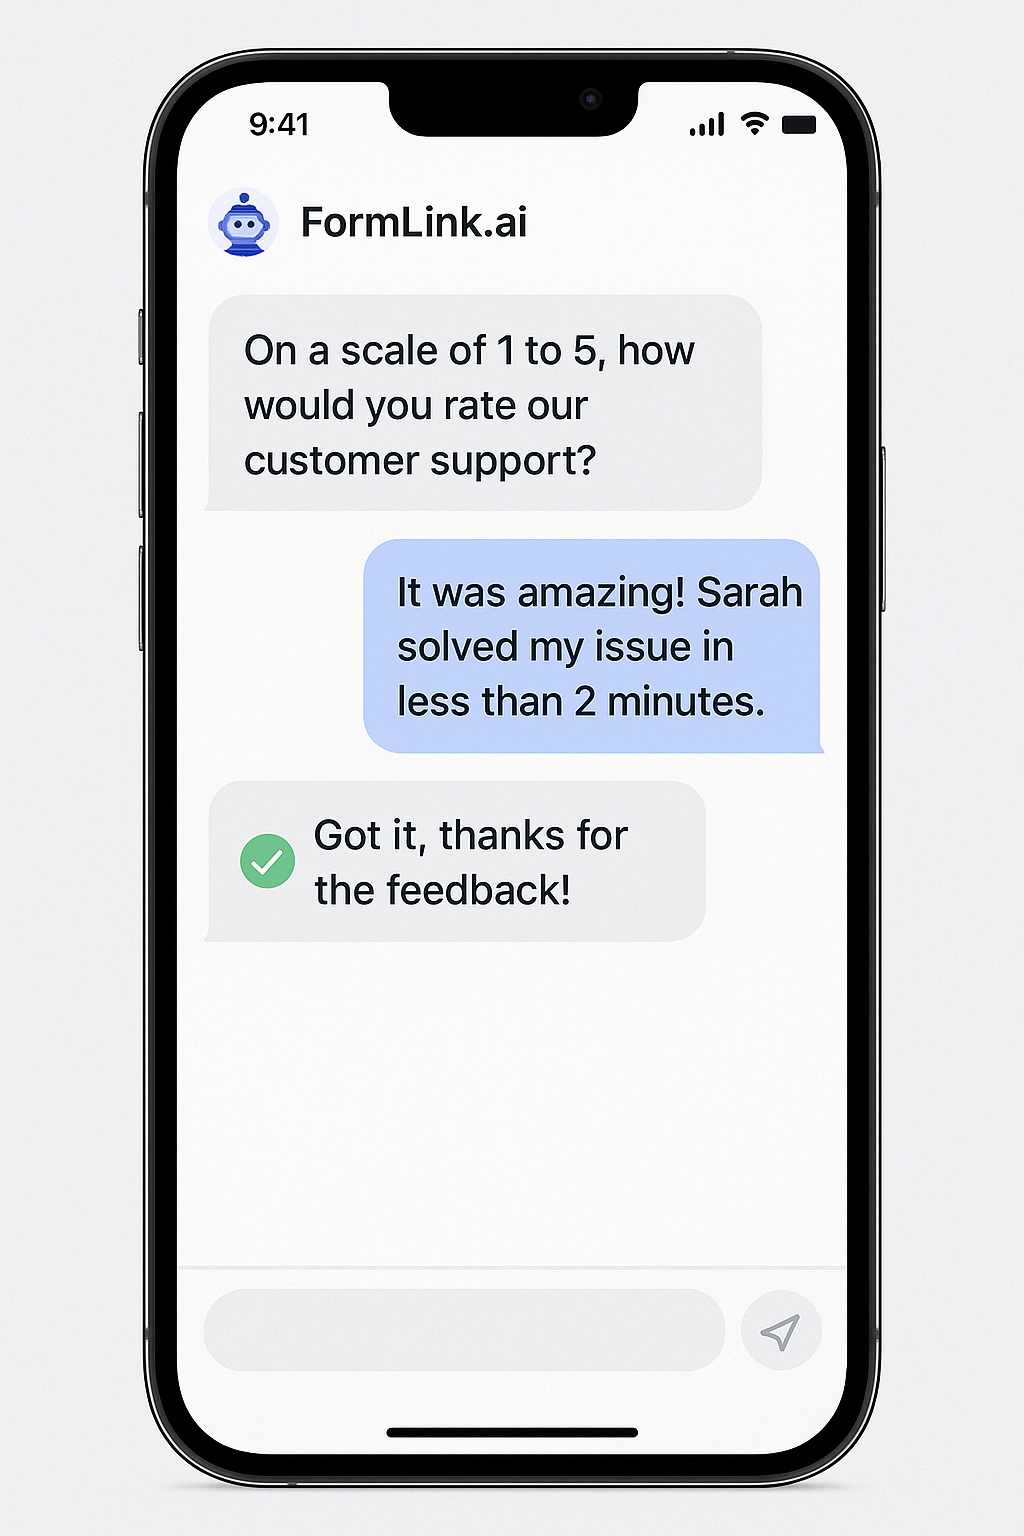
Traditional form builders are tedious to set up and result in a sterile experience. This is where AI changes the game. Instead of presenting a static list of questions, an AI form can turn the process into a conversation.
Imagine asking, "How satisfied were you with our support today?" and instead of a radio button, the user can just type, "It was great, Sarah solved my problem in 5 minutes!" An AI can interpret that sentiment, categorize it as "Very Satisfied," and even tag the response with "fast resolution" and "Sarah."
This conversational approach doesn't just improve completion rates; it gathers richer, more qualitative data alongside the quantitative score. It's the difference between a number and a story.
Conclusion: From Data Points to Decisions
Mastering the Likert scale is about more than just collecting ratings; it's about collecting insights that drive smart decisions. By choosing the right scale (5-point for simplicity, 7-point for detail), writing clear, unbiased questions, and using the right tools, you can transform your feedback process from a chore into a strategic advantage.
Stop settling for useless data. The quality of your feedback determines the quality of your product. Start asking better questions today.
More Resources
- [Internal Link] Learn more about how conversational interfaces can boost your survey engagement.
- [External Link] Pew Research Center offers an excellent guide on the fundamentals of questionnaire design.
- [External Link] A deep dive into response scale effects from the Journal of Marketing Research on JSTOR.